Dashboard Overview
The Dashboard is your operational command center. It gives you a real-time snapshot of your business so you can see what needs attention without clicking through multiple pages.
Use the Dashboard when: You start your day and want to know what needs shipping, what is running low, and how revenue is trending. Think of it as your morning briefing.
Zone 1: Operational Snapshot (top cards)
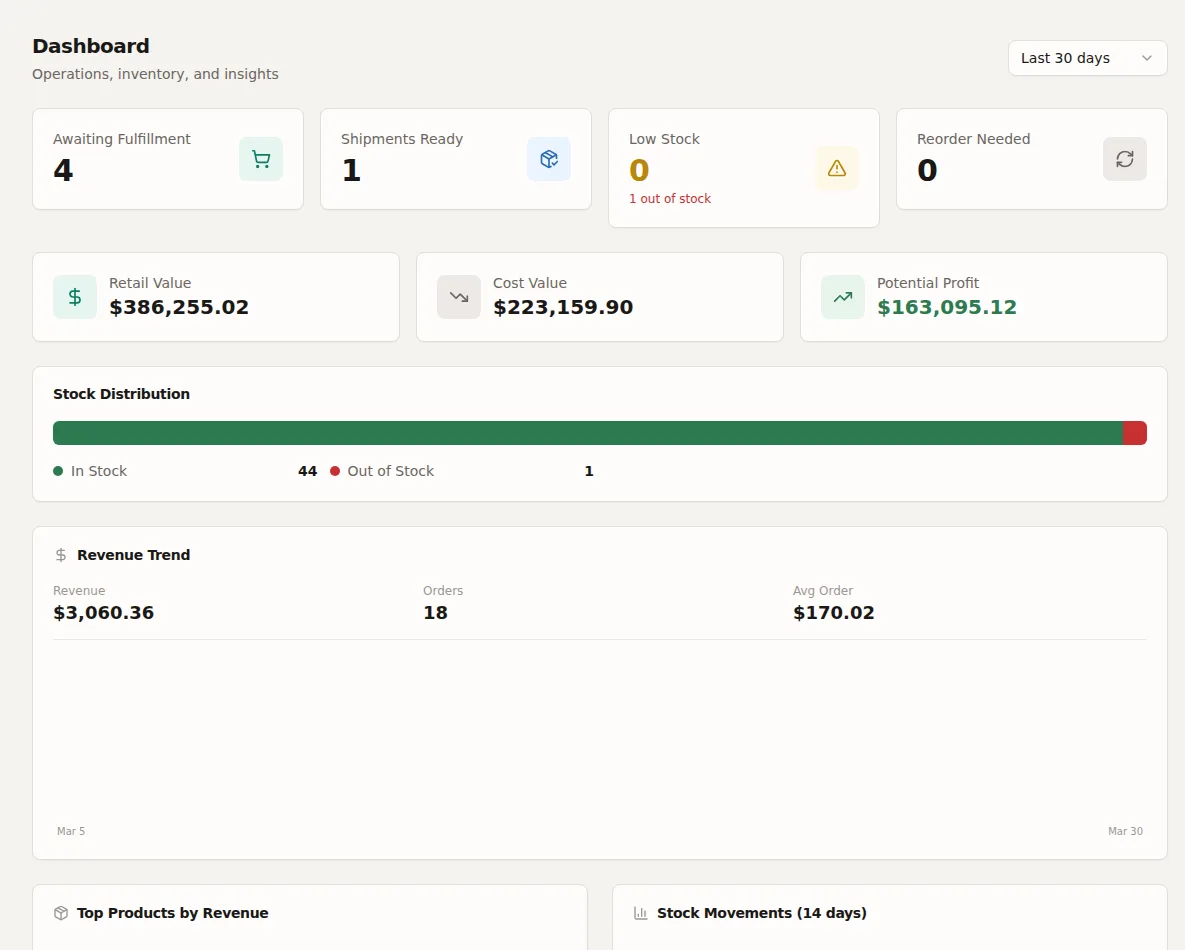
Four clickable cards at the top:
- Awaiting Fulfillment -- Orders in Pending or Processing status that need to be shipped. Click to jump to the filtered Orders page.
- Shipments Ready -- Draft shipments created but not yet shipped. Click to open Shipment Management.
- Low Stock -- Products below their reorder threshold. Shows out-of-stock count underneath.
- Reorder Needed -- Products that need restocking based on reorder point calculations.
Zone 2: Inventory Health
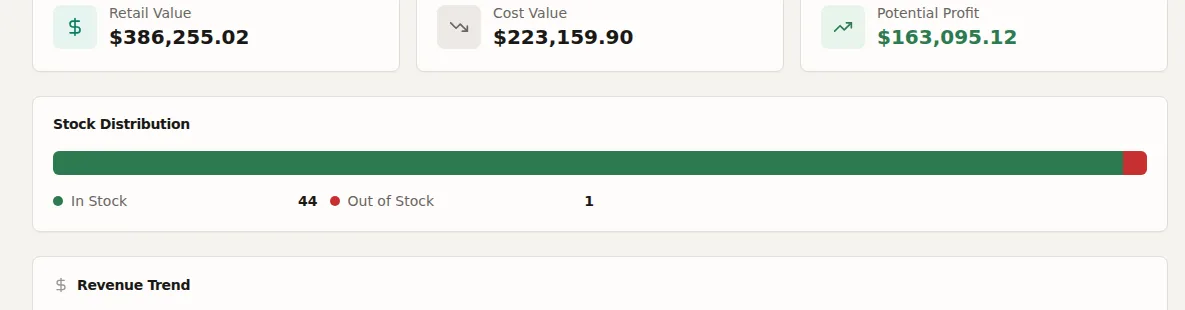
Three value cards:
- Retail Value -- Total retail value of all inventory on hand (price x quantity for all products)
- Cost Value -- Total cost value based on cost prices
- Potential Profit -- Difference between retail and cost value
Below that, a Stock Distribution bar chart showing what percentage of products are In Stock, Low Stock, Out of Stock, or On Backorder. See Stock Status for what each means.
Zone 3: Trends and Insights
- Revenue Trend -- Bar chart showing daily revenue over the selected period (7, 14, 30, or 90 days). Summary stats show total revenue, total orders, and average order value.
- Top Products by Revenue -- Ranked list of your highest-grossing products.
- Stock Movements (14 days) -- Inbound vs outbound stock movement chart.
Zone 4: Alerts and Forecasts
- Stockout Forecast -- Products most likely to run out of stock, ranked by days of stock remaining.
- Recent Movements -- Latest stock changes across your catalog.
- Unread Alerts -- Low stock warnings, sync errors, and other notifications.
Changing the time period
Use the dropdown in the top right to switch between Last 7 days, 14 days, 30 days, or 90 days.